In recent times, Philippine employment levels have exceeded pre-COVID pandemic benchmarks — a recovery driven by regional workforce and demographic shifts.
How the COVID-19 Pandemic Affected PH Employment
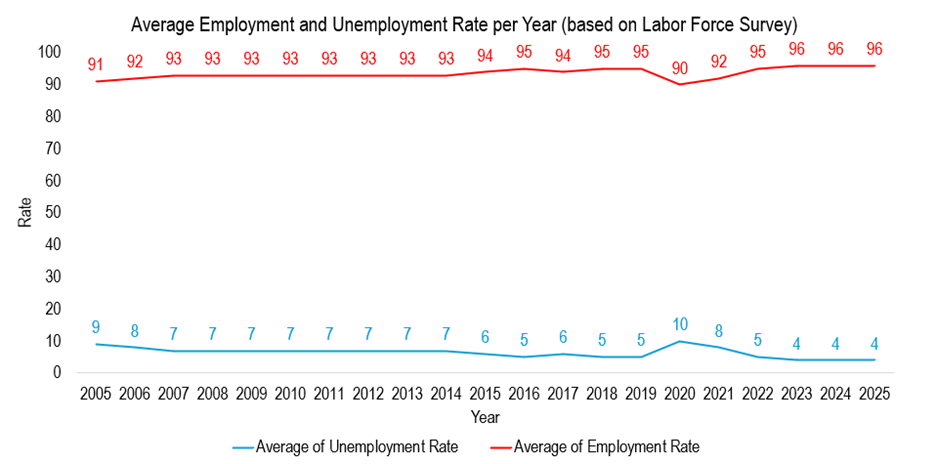
In the past two decades, the Philippines’ average annual employment rate stood at 96%[1]. During the COVID-19 pandemic, it declined significantly, reaching 82% in April 2020 during nationwide lockdowns.
Recovering from the impact of the pandemic, the country was able to revert its employment rate, which stood between 96% ⎻ 97% in 2024. Correspondingly, the unemployment rate declined from a pandemic high of 18% to 4%.
Source: Labor Force Survey, PSA OpenSTAT.
Regional Talent Fueling the Labor Force
Notably, 53.7% of the nation’s workforce comes from five regions[2]. The leading regions are CALABARZON, National Capital Region (NCR), and Central Luzon, which together make up more than 40% of the workforce.
|
Workforce Share by Region (as of December 2021) |
|
|
Region |
Share (as of December 2021) |
| Region IV-A (CALABARZON) | 15.0% |
| NCR | 12.7% |
| Region III (Central Luzon) | 10.9% |
| Region VII (Central Visayas) |
7.5% |
| Region VI (Western Visayas) |
7.4% |
| Region V (Bicol Region) |
5.3% |
| Region X |
5.2% |
| Region I (Ilocos Region) |
4.9% |
| Region XI |
4.8% |
| Region XII (SOCCSKSARGEN) |
4.7% |
| Region VIII (Eastern Visayas) |
4.3% |
| Region II |
3.5% |
| Region IX |
3.5% |
| BARMM |
3.1% |
| MIMAROPA Region | 2.9% |
| CARAGA |
2.7% |
| CAR |
1.7% |
Source: Labor Force Survey, PSA.
Who’s Working Now?
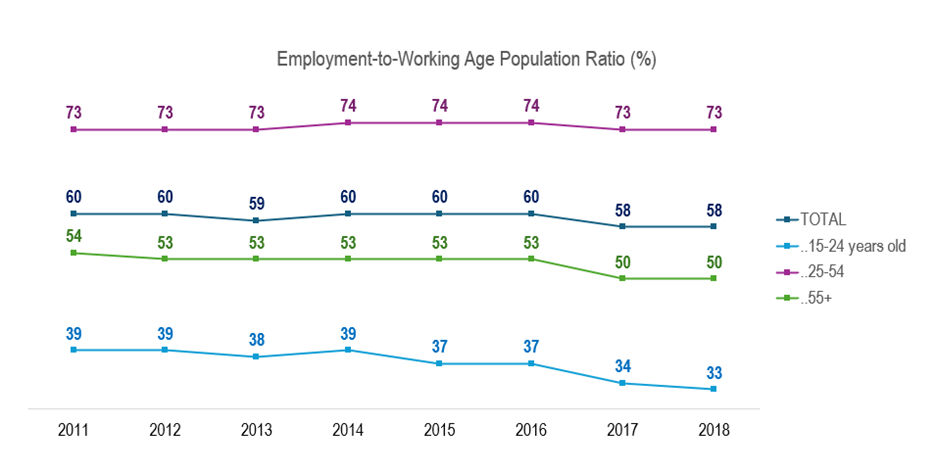
The 2018 Labor Force Survey data shows that 58% of the total working-age population is employed[3]. The core of this workforce lies in the 25 ⎻ 54 age bracket, with an employment rate of 73%.
In contrast, employment among 15 ⎻ 24-year-olds is noticeably lower, partly due to the implementation of the K⎻12 education reform in 2015, which added the SHS curriculum and influenced the delay in labor market entry for younger Filipinos[4].
|
Employment-to-Working Age Population Ratio (%) |
||||||
|
Year |
Total | Men | Women | 15 – 24 years old | 25 – 54 years old |
55 years old and above |
| 1995 | 60 | 76 | 43 | 42 | 72 |
54 |
| 1996 | 61 | 77 | 45 | 44 | 73 |
55 |
| 1997 | 59 | 75 | 44 | 42 | 70 | 53 |
| 1998 | 58 | 73 | 43 | 40 | 69 |
53 |
| 1999 | 59 | 73 | 44 | 41 | 70 |
53 |
| 2000 | 57 | 71 | 42 | 38 | 69 |
52 |
| 2001 | 60 | 74 | 46 | 40 | 73 |
54 |
| 2002 | 60 | 73 | 47 | 40 | 73 |
54 |
| 2003 | 59 | 73 | 45 | 39 | 72 |
53 |
| 2004 | 60 | 74 | 45 | 40 | 72 |
54 |
| 2005 | 59 | 73 | 46 | 39 | 72 |
54 |
| 2006 | 59 | 73 | 46 | 39 | 72 |
53 |
| 2007 | 59 | 73 | 46 | 38 | 73 |
53 |
| 2008 | 59 | 73 | 45 | 37 | 73 |
53 |
| 2009 | 59 | 73 | 46 | 38 | 73 |
53 |
| 2010 | 59 | 73 | 46 | 37 | 73 |
54 |
| 2011 | 60 | 73 | 47 | 39 | 73 |
54 |
| 2012 | 60 | 73 | 47 | 39 | 73 |
53 |
| 2013 | 59 | 72 | 47 | 38 | 73 |
53 |
| 2014 | 60 | 73 | 48 | 39 | 74 |
53 |
| 2015 | 60 | 72 | 47 | 37 | 74 |
53 |
| 2016 | 60 | 73 | 47 | 37 | 74 |
53 |
| 2017 | 58 | 72 | 44 | 34 | 73 |
50 |
| 2018 | 58 | 71 | 44 | 33 | 73 |
50 |
Source: Decent Work Statistics, PSA OpenSTAT.
Looking Ahead
The steady recovery of the Philippine labor force highlights the country’s ability to bounce back from economic lows and highs. With employment levels now surpassing pre-pandemic figures and younger generations gradually entering the market, the nation’s workforce stands at a pivotal point that’s shaped by demographic shifts and emerging opportunities across regions.
Sustaining this progress will require inclusive employment opportunities, skills development, and stronger regional support to ensure that every Filipino can thrive in an evolving world of work.
Key Takeaways
The Philippine labor force highlights the country’s resilience and ability to bounce back from economic lows, with current employment levels exceeding pre-pandemic figures.
- ➣ Strong Labor Market Rebound: The employment rate has recovered dramatically from the pandemic low of 82% in April 2020 to stand between 96% and 97% by 2024, with the unemployment rate declining to 4%.
- ➣ Regional Concentration of Labor: Over half (53.7%) of the nation’s workforce is concentrated in the top five regions, with CALABARZON, NCR, and Central Luzon being the primary contributors.
- ➣ Demographic Cornerstone: The 25 – 54 age group is the most employed demographic, consistently maintaining a high employment-to-working age population ratio (73% in 2018).
- ➣ Need for Inclusive Growth: Sustaining this progress requires inclusive employment opportunities, skills development, and stronger regional support to ensure every Filipino can thrive in the evolving world of work.
Share


How do you feel about this article?


References:
[1] Key Employment Indicators by Year, Month, Levels and Sex: April 2005 to September 2025. Labor and Employment | OpenSTAT | Philippine Statistics Authority. (n.d.). https://openstat.psa.gov.ph/PXWeb/pxweb/en/DB/DB__1B__LFS/0011B3GKEI1.px/?rxid=227f6805-9732-41b6-981c-ac178832d6db%E2%80%8B
[2] 2023 Annual Provincial Labor Market Statistics (Preliminary Results). Labor Force Survey | Philippine Statistics Authority | Republic of the Philippines. Philippine Statistics Authority. (2024, November 14). https://psa.gov.ph/statistics/labor-force-survey/node/1684065368
[3] Employment-to-Working Age Population Ratio by Sex and Age Group. Decent Work Statistics | OpenSTAT | Philippine Statistics Authority. (n.d.). https://openstat.psa.gov.ph/PXWeb/pxweb/en/DB/DB__3K__E2/0183K3F2010.px/?rxid=37c35de1-2ef9-4fa3-b249-167d01c5e44b
[4] Estacio, M. P. (2015, September 2). All set for K to 12 implementation. Department of Education. https://www.deped.gov.ph/2015/09/02/all-set-for-k-to-12-implementation/