As the Philippine population continues to grow, different regional and demographic trends have influenced its ever-changing landscape.
An Upwards Trajectory
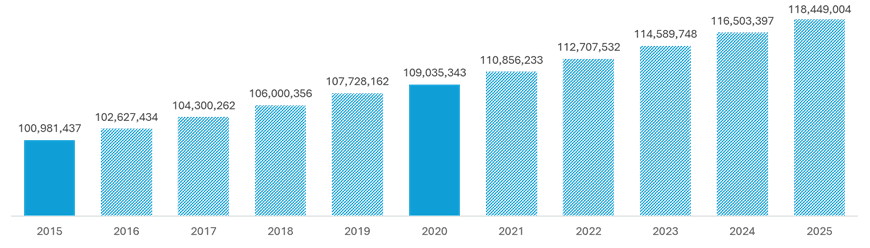
The 2020 Census of Population and Housing showed that the country recorded 109 million individuals[1], projected to reach 118.4 million by 2025. That said, the Philippine population has been steadily increasing at a rate of 1.63% annually since 2015.
|
Philippine Population by Year based on Census of Population and Housing |
|
|
Year |
Population |
|
2015 |
100,981,437 |
|
2016 |
102,627,434 |
|
2017 |
104,300,262 |
|
2018 |
106,000,356 |
|
2019 |
107,728,162 |
|
2020 |
109,035,343 |
|
2021 |
110,856,233 |
|
2022 |
112,707,532 |
|
2023 |
114,589,748 |
|
2024 |
116,503,397 |
|
2025 |
118,449,004 |
Source: Census of Population and Housing, Philippine Statistics Authority (PSA).
New Regions
Recent administrative adjustments have influenced the population landscape of the Philippines. The re-establishment of the Negros Island Region (NIR) in the current administration brings together Negros Occidental, Negros Oriental, and Siquijor[2]. This led to the increase of the total number of Philippine regions into 18.
In Mindanao, the Special Geographic Area (SGA) has been formally recognized as a new province under the Bangsamoro Autonomous Recognition in Muslim Mindanao (BARMM)[3]. This area currently comprises eight municipalities, increasing the total number of municipalities nationwide from 1,485 to 1,493.
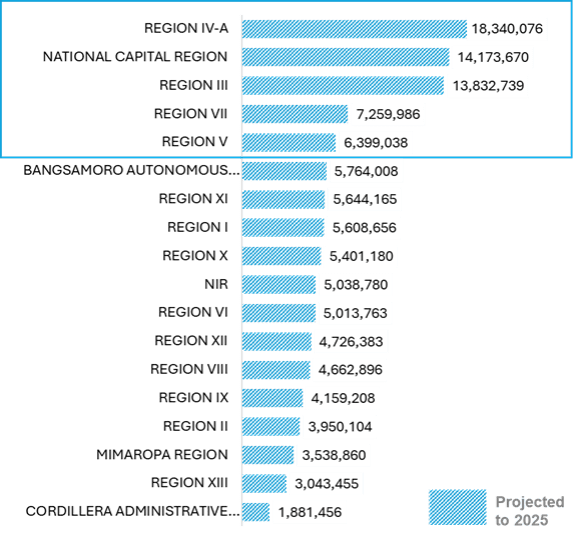
Across the regions, CALABARZON (Region IV-A) remains the most populated, accounting for 15% of the total population, followed by the National Capital Region (NCR) with 12%[4]. The top five regions combined already represent about half of the total Philippine population — approximately 60 million Filipinos projected by 2025.
|
Population by Region |
|
| Regions |
Population |
| Region IV-A |
18,340,076 |
| National Capital Region |
14,173,670 |
| Region III |
13,832,739 |
| Region VII |
7,259,986 |
| Region V |
6,399,038 |
| Bangsamoro Autonomous Region in Muslim Mindanao |
5,764,008 |
| Region XI |
5,644,165 |
| Region I | 5,608,656 |
| Region X |
5,401,180 |
| Negros Island Region | 5,038,780 |
| Region VI |
5,013,763 |
| Region XII |
4,726,383 |
| Region VIII |
4,662,896 |
| Region IX |
4,159,208 |
| Region II |
3,950,104 |
| MIMAROPA Region |
3,538,860 |
| Region XIII |
3,043,455 |
| Cordillera Administrative Region |
1,881,456 |
Source: 2020 Census of Population and Housing, Philippine Statistics Authority (PSA).
A Young Nation
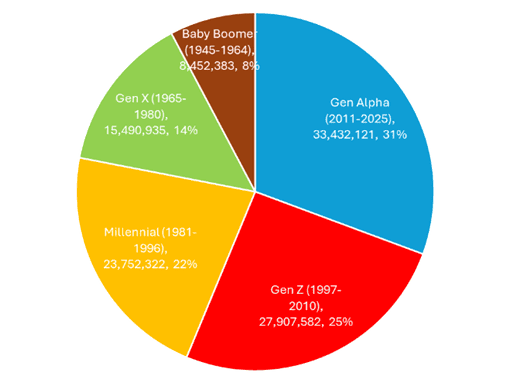
Notably, the Philippines has a distinctly young demographic profile. More than half (56%) of Filipinos are under 29 years old, belonging to Generation Z and Generation Alpha[4]. Millennials and Gen Z together make up nearly half of the entire population, underscoring their growing influence in the labor force, consumer market, and digital culture.
|
Individual Population by Generation (based on 2020 Census of Population and Housing) |
||
| Generation | Population |
% in Population |
| Baby Boomers (1945 – 1964) | 8,452,383 |
8% |
| Gen X (1965 – 1980) | 15,490,935 |
14% |
| Millennial (1981 – 1996) | 23,752,322 |
22% |
| Gen Z (1997 – 2010) | 27,907,582 |
25% |
| Gen Alpha (2011 – 2025) | 33,432,121 |
31% |
Source: 2020 Census of Population and Housing, Philippine Statistics Authority (PSA)
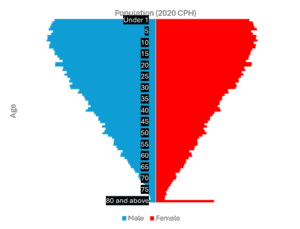
Gender balance remains relatively even across most age groups, women just slightly outnumber men in the senior population. The country’s age pyramid remains triangular, indicating once again a younger demographic profile.
|
Population by Gender and Age |
||
| Age | Male |
Female |
| Under 1 | 1,109,532 |
1,026,500 |
| 1 | 1,133,593 |
1,066,241 |
| 2 | 1,145,369 |
1,073,347 |
| 3 | 1,154,752 |
1,081,773 |
| 4 | 1,171,150 |
1,107,222 |
| 5 | 1,127,721 |
1,045,899 |
| 6 | 1,147,885 |
1,064,960 |
| 7 | 1,187,453 |
1,102,219 |
| 8 | 1,184,593 |
1,099,880 |
| 9 | 1,194,592 |
1,115,435 |
| 10 | 1,155,278 |
1,076,557 |
| 11 | 1,165,946 |
1,096,881 |
| 12 | 1,170,873 |
1,095,333 |
| 13 |
1,123,341 |
1,059,585 |
| 14 |
1,106,452 |
1,041,116 |
| 15 |
1,106,453 |
1,040,470 |
| 16 |
1,075,936 |
1,023,661 |
| 17 | 1,056,915 |
1,014,865 |
| 18 |
1,022,474 |
991,271 |
| 19 |
1,099,023 |
1,051,747 |
| 20 |
1,103,638 |
1,050,354 |
| 21 |
1,014,810 |
970,363 |
| 22 |
1,021,806 |
983,345 |
| 23 |
974,024 |
942,248 |
| 24 |
1,000,965 |
963,200 |
| 25 |
969,156 |
932,464 |
| 26 |
939,217 |
906,639 |
| 27 |
948,729 |
909,340 |
| 28 |
916,778 |
877,154 |
| 29 |
941,222 |
888,589 |
| 30 | 934,841 |
876,085 |
| 31 | 840,962 |
791,716 |
| 32 |
851,482 |
797,467 |
| 33 |
808,148 |
756,521 |
| 34 |
783,368 |
730,833 |
| 35 |
773,656 |
725,276 |
| 36 |
740,574 |
701,626 |
| 37 |
740,687 |
699,114 |
| 38 |
714,283 |
678,617 |
| 39 |
744,072 |
703,880 |
| 40 |
766,614 |
712,253 |
| 41 |
678,104 |
642,844 |
| 42 |
658,227 |
623,851 |
| 43 |
627,817 |
596,208 |
| 44 |
627,854 |
595,074 |
|
45 |
608,253 |
572,497 |
| 46 |
557,325 |
534,443 |
| 47 |
589,223 |
561,246 |
| 48 | 549,285 |
525,610 |
| 49 |
562,465 |
538,418 |
| 50 |
581,579 |
557,524 |
| 51 |
522,844 |
510,245 |
| 52 |
481,335 |
473,892 |
| 53 |
458,847 |
456,809 |
| 54 |
461,355 |
460,199 |
| 55 |
462,578 |
459,195 |
| 56 |
430,136 |
430,529 |
| 57 | 418,330 |
422,663 |
| 58 |
365,992 |
371,437 |
| 59 |
382,373 |
394,109 |
| 60 |
388,806 |
401,095 |
| 61 |
342,585 |
361,198 |
| 62 |
313,872 |
334,287 |
| 63 |
301,344 |
330,141 |
| 64 |
286,871 |
315,091 |
| 65 |
272,916 |
303,833 |
| 66 |
238,833 |
271,622 |
| 67 |
227,361 |
262,250 |
| 68 |
186,359 |
219,475 |
| 69 |
188,815 |
226,652 |
| 70 |
180,971 |
222,626 |
| 71 |
148,172 |
191,081 |
| 72 |
133,293 |
174,831 |
| 73 |
120,421 |
163,091 |
| 74 |
100,986 |
142,713 |
| 75 |
89,091 |
130,007 |
| 76 |
74,577 |
113,117 |
| 77 |
77,468 |
119,924 |
| 78 |
65,690 |
104,005 |
| 79 |
59,306 |
99,046 |
| 80 years and over |
316,771 |
641,528 |
Source: 2020 Census of Population and Housing, Philippine Statistics Authority (PSA)
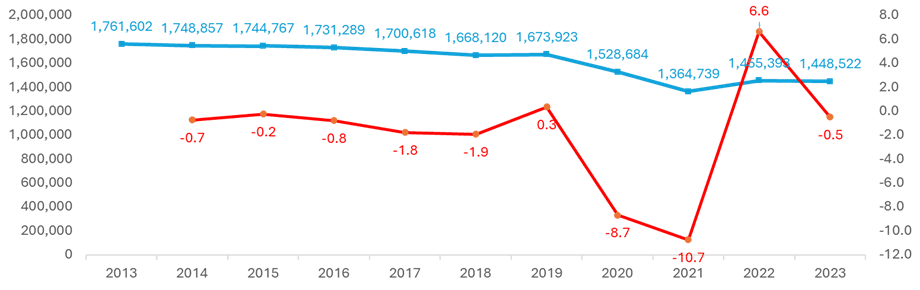
Declining Birth Rates
Despite the overall population growth, a decline in live births in the country has been recorded at an average rate of -1.8% per year from 2013 to 2023[5]. Its downward trend became more pronounced during the COVID-19 pandemic, dropping sharply by -8.7% in 2020 and -10.7% in 2021.
|
Trend of Live Births |
||
| Year | Annual Live Births |
Growth Rate of Live Births (in %) |
| 2013 |
1,761,602 |
|
| 2014 |
1,748,857 |
-0.7 |
| 2015 |
1,744,767 |
-0.2 |
| 2016 |
1,731,289 |
-0.8 |
| 2017 |
1,700,618 |
-1.8 |
| 2018 |
1,668,120 |
-1.9 |
| 2019 |
1,673,923 |
0.3 |
| 2020 |
1,528,684 |
-8.7 |
| 2021 |
1,364,739 |
-10.7 |
| 2022 |
1,455,393 |
6.6 |
| 2023 |
1,448,522 |
-0.5 |
Source: Registered Live Births in the Philippines, 2023, Philippine Statistics Authority.
Key Takeaways
- ➣ Steady Population Growth: The Philippines’ population, recorded at 109 million in the 2020 Census of Population and Housing, is projected to reach 118.4 million by 2025. Since 2015, the population has been increasing at an annual rate of 1.63%.
- ➣ Regional Concentration: The population remains highly concentrated in a few areas. CALABARZON (Region IV-A) is the most populated region, accounting for 15% of the total population, followed by the National Capital Region (NCR) with 12%. The top five regions combined are projected to house approximately 60 million Filipinos by 2025.
- ➣ Administrative Adjustments: Recent administrative changes have influenced the landscape:
- ▪︎ The total number of Philippine regions has increased to 18 with the reestablishment of the Negros Island Region (NIR).
- ▪︎ The formal recognition of the Special Geographic Area (SGA) as a new province under BARMM increased the total number of municipalities nationwide from 1,485 to 1,493.
- ➣ Distinctly Young Demographic Profile: The Philippines has a triangular age pyramid, indicating a young population. More than half (56%) of Filipinos are under 29 years old, belonging to Generation Z and Generation Alpha.
- ➣ Declining Birth Rates: Despite overall population growth, the country has recorded a decline in live births at an average rate of $-1.8\%$ per year from 2013 to 2023.
Share


How do you feel about this article?


References:
[1] Highlights of the Philippine Population 2020 Census of Population and Housing (2020 CPH). Population and housing | Philippine Statistics Authority | Republic of the Philippines. Philippine Statistics Authority. (2021, July 13). https://psa.gov.ph/statistics/population-and-housing/node/164811
[2] Second quarter 2024 PSGC updates: Creation of the Negros Island Region and Correction of the Names of Two Barangays. Philippine Standard Geographic Code. (2024, July 12). https://psa.gov.ph/classification/psgc/node/1684064747
[3] Eight New Municipalities in the Bangsamoro Autonomous Region in Muslim Mindanao. Philippine Standard Geographic Code. (2024, May 8). https://psa.gov.ph/classification/psgc/node/1684063552
[4] Population by Age Group, Sex, Region, and Province/Highly Urbanized City: Philippines , 2020. Population and Migration | OpenSTAT | Philippine Statistics Authority. (n.d.). https://openstat.psa.gov.ph/PXWeb/pxweb/en/DB/DB__1A__PO/0021A6DPAG0.px/?rxid=22115498-0a6f-49b9-abec-0bb4e1316e79
[5] Registered Live Births in the Philippines, 2023. Philippine Statistics Authority | Republic of the Philippines. Philippine Statistics Authority. (2024, December 20). https://psa.gov.ph/content/registered-live-births-philippines-2023?fbclid=IwY2xjawKJCWJleHRuA2FlbQIxMABicmlkETF0N0ZTNEVlcWpyMjF5cElCAR5n8s-2hTCmPWxPC4ivxHg5sL3RwV7yQ6ItRA6nHo50zfin9wp2do1HLa2jcw_aem_lngXL9LzUi47zUGFO-RPGg